A/B testing is one of the easiest ways to find optimization ideas for your post-click landing pages, but it’s not always the most efficient way.
Before you start testing two, three, or four pages at a time, find out how to test even more, and discover the best combination of elements to convert your visitors.
What is A/B testing?
A/B testing, also known as split-testing, allows you to compare two different versions of a web page to determine which converts visitors better.
Those two pages can be:
- Slightly different
If you have a high-converting design and you want to figure out how to improve a single element, you can test two different pages with only one difference. If you want to see whether a curiosity or news-focused headline performs better, you can test headline vs. headline. If you want to see whether a video or a gif impacts conversions more, you can test one on each page.
After driving equal traffic to each one, the one that generates the most conversions is the winner. And the reason that one generated more conversions is clear, since there’s only one difference between the two pages.
- Drastically different
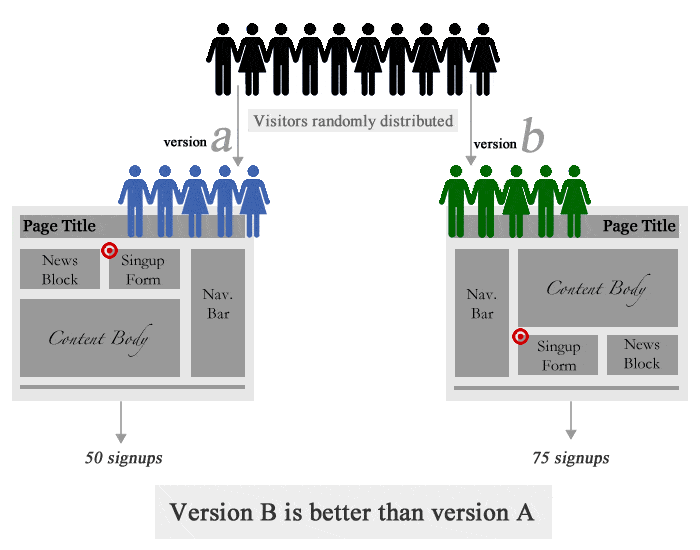
You can also test two pages that are different in multiple ways. Your original page can have a different headline, featured image, and call-to-action button than your variation. Testing it might look something like this:

After driving equal traffic to both the original page (A or “control”) and the variation page (B), the one that converts better is the winner. But unlike when you change only one element per test, when you test drastically different pages there’s no way of determining the reason a particular page won.
Taking the results of the example above, we would only know that version “b” is better than version “a,” but not the reason why it’s better, as there are a number of causes it could be attributed to. Conversions could’ve come from the adjustment of the navigation bar from left to right, or from the signup form from top to bottom. All you can tell for sure when you A/B test drastically different designs are that one page is better than the other.
But, there’s a different kind of test you can run to determine how changes to multiple elements interact with each other. It’s called a multivariate test.
What is multivariate testing?
Multivariate testing is the process used by optimizers to compare two different web pages. The method focuses on comparing subtle changes between multiple elements, then measuring how those elements interact with each other, with the goal of finding the highest performer.
The difference between A/B testing and multivariate testing
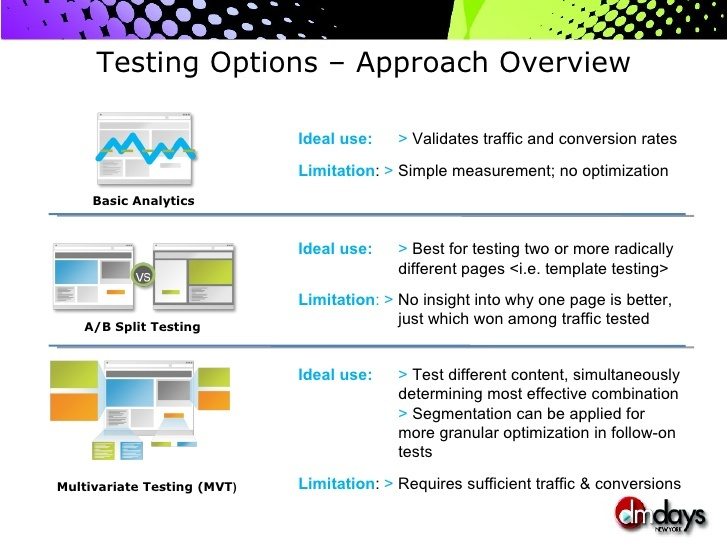
You’ve probably read a lot of A/B testing case studies that find a winning page by comparing one headline to another, or a featured image vs. a video, or one call-to-action vs. a slightly different one. While they can be used to do that with accuracy, according to optimizers at Widemile, there’s a more ideal way to use A/B testing:

The ideal use for A/B testing, they say, is for “testing two or more radically different pages.” In testing terms, it’s better to A/B test to find what’s called the “global maximum,” and multivariate test to refine towards the “local maximum.”
The global maximum and the local maximum
As hard as it is to do, imagine for a second that you’ve never had a scoop of ice cream in your life, and you’re standing in an ice cream parlor trying to decide which one of 30 different flavors you want to purchase.
There are 10 different kinds of chocolate, 10 different varieties of vanilla, and 10 different variations of strawberry. Are you going to try all 30 flavors before you decide which one you want a scoop of?
Probably not. You’re likely going to try one of each drastically different flavor — one chocolate, one strawberry, and one vanilla — to narrow down which variety you’ll like the most. If you discover you like chocolate over vanilla and strawberry, you’ll start trying flavors like “chocolate chip cookie dough,” and “chocolate peanut-butter” and “chocolate-fudge” to decide which of the chocolates you like most.
In statistical terms, we’d call the variety you liked the most (chocolate, vanilla, or strawberry) the global maximum. This is the flavor that tastes best to you out of the three drastically different types. The specific flavor of the variety (chocolate-fudge, chocolate chip cookie dough, chocolate peanut butter) would be the local maximum. It’s the best version of the variety that you chose.
As an optimizer, you want to approach testing similarly. You want to find the page that best converts your visitors (global maximum), and then tweak the specific elements on that page to improve it to the highest-converting page it can be (local maximum). Which you’re looking for will determine which test you use.
When to use A/B testing and when to use multivariate testing
A/B tests are best for testing the global maximum. They’re best at discovering which page your visitors want to convert on. Take this example from MarketingExperiments, who used an A/B test to help Investopedia boost conversions for its newsletter, Investopedia Advisor.
The offer was simple — a free newsletter with stock tips — and so the original page reflected that. It wasn’t long, complicated, or cluttered with many elements. It featured a one-field lead capture form, bulleted copy, and an infographic:

But, despite the valuable free offer, it was only converting at 1.33%. The team at MarketingExperiments decided to completely overhaul the page. They changed the headline, layout, CTA button, and added some badges, among other things. Then they A/B tested the new page vs. the original, and they found the new one converted 89.4% higher. Here’s what it looked like:

It’s important to remember that with this A/B test, the experimenters didn’t figure out exactly why the new page converted better than the old one, but they did find a new higher converter. In other words, they found a new global maximum. At that point, if they desired, they could refine this page with multivariate testing to determine which combination of elements converts the most visitors.
That’s exactly what testers in this hypothetical example from Optimizely want to do, for instance. They want to figure out which combination of headline and image converts the most visitors.

So, they create multiple pages with different combinations of headlines and images to see which performs the best.

Whichever of these four versions emerges from the test with the highest conversion rate is the winner. If the two versions with the light bulb perform better than the two with the gear, you might conclude that the light bulb image has the biggest impact on conversions. From there, you’d see which accompanying headline produced more conversions, and use that page.
How to conduct a multivariate test
A few years ago, when VWO founder Paras Chopra wanted to boost downloads on his web page, he used multivariate testing to figure out how. If you’re familiar with the steps for conducting an A/B test, you’ll recognize most of the steps in this multivariate test example.
1. Identify a problem
Before you can start improving your web page, it’s best to dig into data and find out how visitors are interacting with it. What he found was that people weren’t clicking his “download” button as much as he anticipated they should’ve been, so he surveyed the page to figure out why.
2. Formulate a hypothesis
After a thorough examination, he realized that the download link was quite unnoticeable. So he created a hypothesis for improving the page:
An obvious solution to make visitors notice the download link is to make the download section the most prominent part of the page. In the page design, the “Download” heading size and color blended well into the rest of the page, which resulted in people missing the download link.
By making the “Download” link more noticeable, he believed he’d be able to boost conversions. Here’s how he decided to do it.
3. Create variations
Now it was time to create variation pages for the test. According to Paras:
For the multivariate test, I selected two factors on the page for creating variations: the “Download” heading in the sidebar and the “PDFProducer” download link below it. The focus of the test was to observe the effect of the word “free,” and the effect of highlighting the download section.
Here’s how he decided to make the download section more noticeable and enticing.
For the original “Download” link, he tested three different variations:
- “Download” in red
- “Download for Free” in red
- “Download” in default color, but a larger font size
For the original “PDFProducer” link, he tested two different variations:
- “PDFProducer” in default color, but a larger font size
- “PDFProducer” in red
This is what all the combinations looked like:

With four versions of the download link (including the original) and three versions of the “PDFProducer” text (again, including the original), 12 different variations were formed to conduct a full factorial test. A full factorial tests all combinations as opposed to a fractional factorial that only tests the most impactful.
While there are multiple methods of multivariate analysis — full factorial, fractional factorial, and Taguchi — most optimizers recommend running a full factorial for its accuracy, claims Alex Birkett of CXL.
4. Determine your sample size
Before you start driving traffic to your pages, you need to determine your sample size — the number of visitors each page needs to generate before you can make conclusions about the results of your test.
This calculator from VWO will help you figure out how many visitors, and how long you need to run your test based on your website traffic, how many variations you have, and your statistical significance.
To learn more about reaching statistical significance, and all the things you need to punch into the calculator, check out this blog post.
5. Test your tools
Test everything before you start running traffic. Does your post-click landing page look the same in every browser? Is your CTA button working? Are all the links in your ads correct?
Before you start running anything, it’s important to QA every aspect of your campaign to ensure nothing poisons your results.
6. Start driving traffic
Now that you’ve created your variations and know how much traffic you’ll need to generate to each one, it’s safe to start driving traffic to them. The biggest downside to multivariate tests is the colossal amount of traffic you’ll need before you can conclude them, so you’ll need to be patient.
When you’re A/B testing, there are only two pages to which you’ll need to drive significant traffic. But in a multivariate test, like Paras’s for example, there are 12 different pages that have to collect a large sample size before you can call the test.
Keep an eye out for threats to your validity and don’t forget to account for the increased rate of false positive results, says Leonid Pekelis:
“You’re essentially running a separate A/B Test for each interaction. If you’ve got 20 interactions to measure, and your testing procedure has a 5% rate of finding false positives for each one, you all of a sudden expect about one interaction to be detected significant completely by chance. There are ways to account for this, they’re generally called multiple testing corrections, but again, the cost is you tend to need more visitors to see conclusive results.”
7. Analyze your results
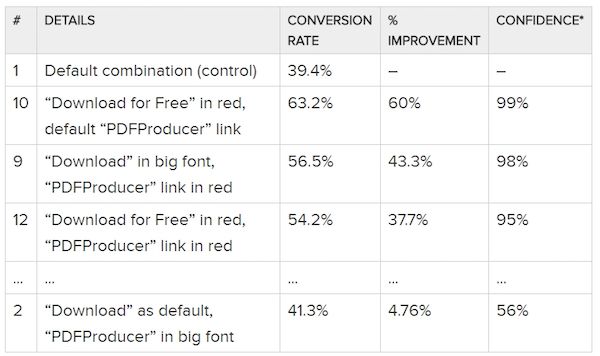
After running his test for four weeks, this is what Paras found:

You can observe that the headline “Download for Free” in red pushed the download conversion rate from 39% to 63%, a whopping increase of 60%. Having “Download” in large font size (combined with link color as red) also had a positive (43%) improvement over the default. Of all results, the top three are statistically significant at 95% or more confidence level.
Paras could’ve implemented his new page and forgot about this test, but instead, he emphasizes an important final step:
8. Learn from your results
Each one of your tests should be used to learn something about your web pages and their visitors that you can use to inform future tests.
He learned that, on his web page:
- The word “Free” resonated with his website visitors.
- The no-cost nature of the offer is best advertised on or near the call-to-action.
- The color red drew his visitors’ attention.
- A bigger call-to-action attracted more visitor eyeballs.
But remember, these are the results of his test. While the word “free” is always good to use on any web page that advertises a no-cost offer, the best location, size, and color of your CTA might be different on your web pages. The only way to know for sure is to test.
Have you tried multivariate testing?
Have you strayed from multivariate testing because you thought it was too complicated? Sign up for an Instapage Enterprise demo today.

See the Instapage Enterprise Plan in Action.
Demo includes AdMap™, Personalization, AMP,
Global Blocks, heatmaps & more.
